Visualization#
SynKit’s visualization layer has two roles:
chemistry-first drawings for molecular graphs, reaction panels, and ITS graphs;
diagnostic graph drawings for raw NetworkX objects, adapters, and future MTG development.
For normal chemistry work, prefer the molecule, reaction, and ITS helpers from
synkit.Vis. The generic graph drawer is useful when debugging attributes or
new graph representations, but it is intentionally less polished.
Molecular Graphs From SMILES#
Start from a real SMILES, convert it to a SynKit molecular graph, and draw it with atom-map-aware labels.
from synkit.IO.chem_converter import smiles_to_graph
from synkit.Vis import draw_molecule_graph

smiles = "CC(=O)OC1=CC=CC=C1C(=O)O"
graph = smiles_to_graph(
    smiles,
    sanitize=True,
    use_index_as_atom_map=True,
)

ax = draw_molecule_graph(
    graph,
    title=smiles,
    label_mode="hetero",
    show_atom_map=True,
    aromatic_style="circle",
)
ax.figure
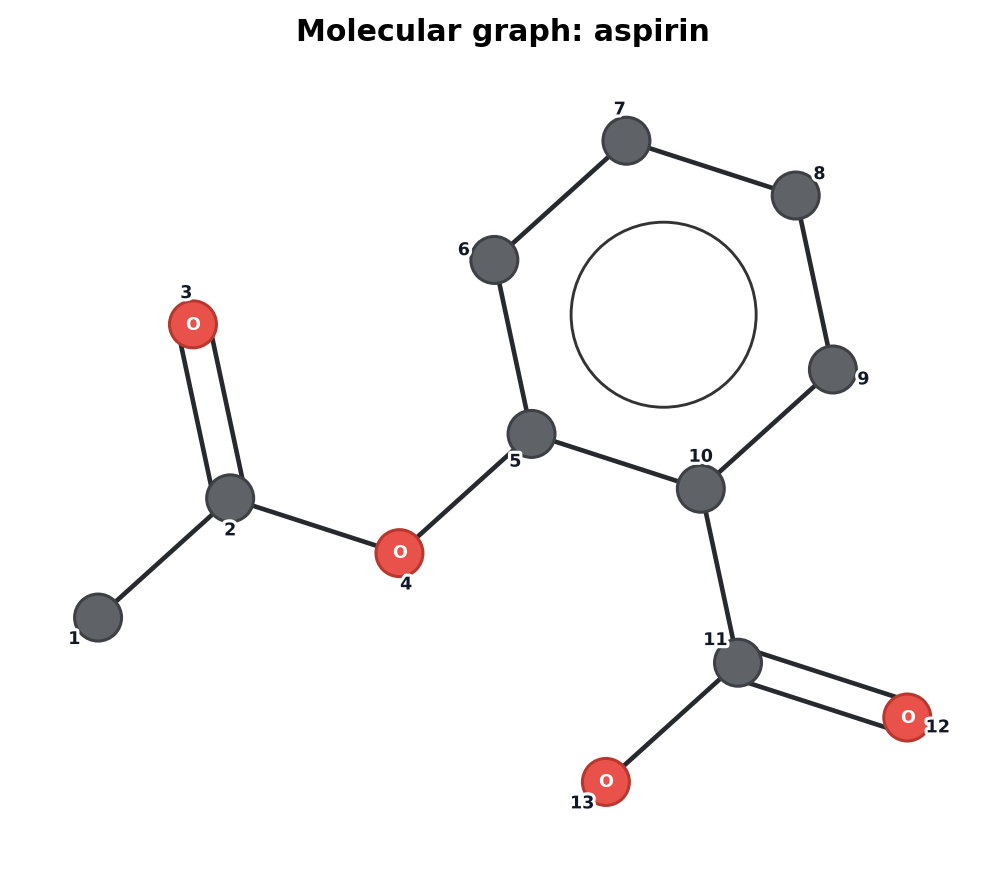
Figure: A molecular graph rendered from aspirin SMILES with aromatic rings drawn compactly and atom indices visible.
Useful molecule options:
Option |
Use |
|---|---|
|
Keep carbon labels compact while showing hetero atoms explicitly. |
|
Show atom-map numbers when present. |
|
Draw aromatic rings with a compact ring marker instead of cluttered edge labels. |
Reaction Panels#
Reaction drawings show reactants and products side by side and highlight atoms and bonds that change.
from synkit.Vis import draw_reaction_graph

rsmi = "[CH3:1][Cl:2].[NH3:3]>>[CH3:1][NH3+:3].[Cl-:2]"

fig, axes = draw_reaction_graph(
    rsmi,
    title="SN2 reaction",
    show_atom_map=True,
)
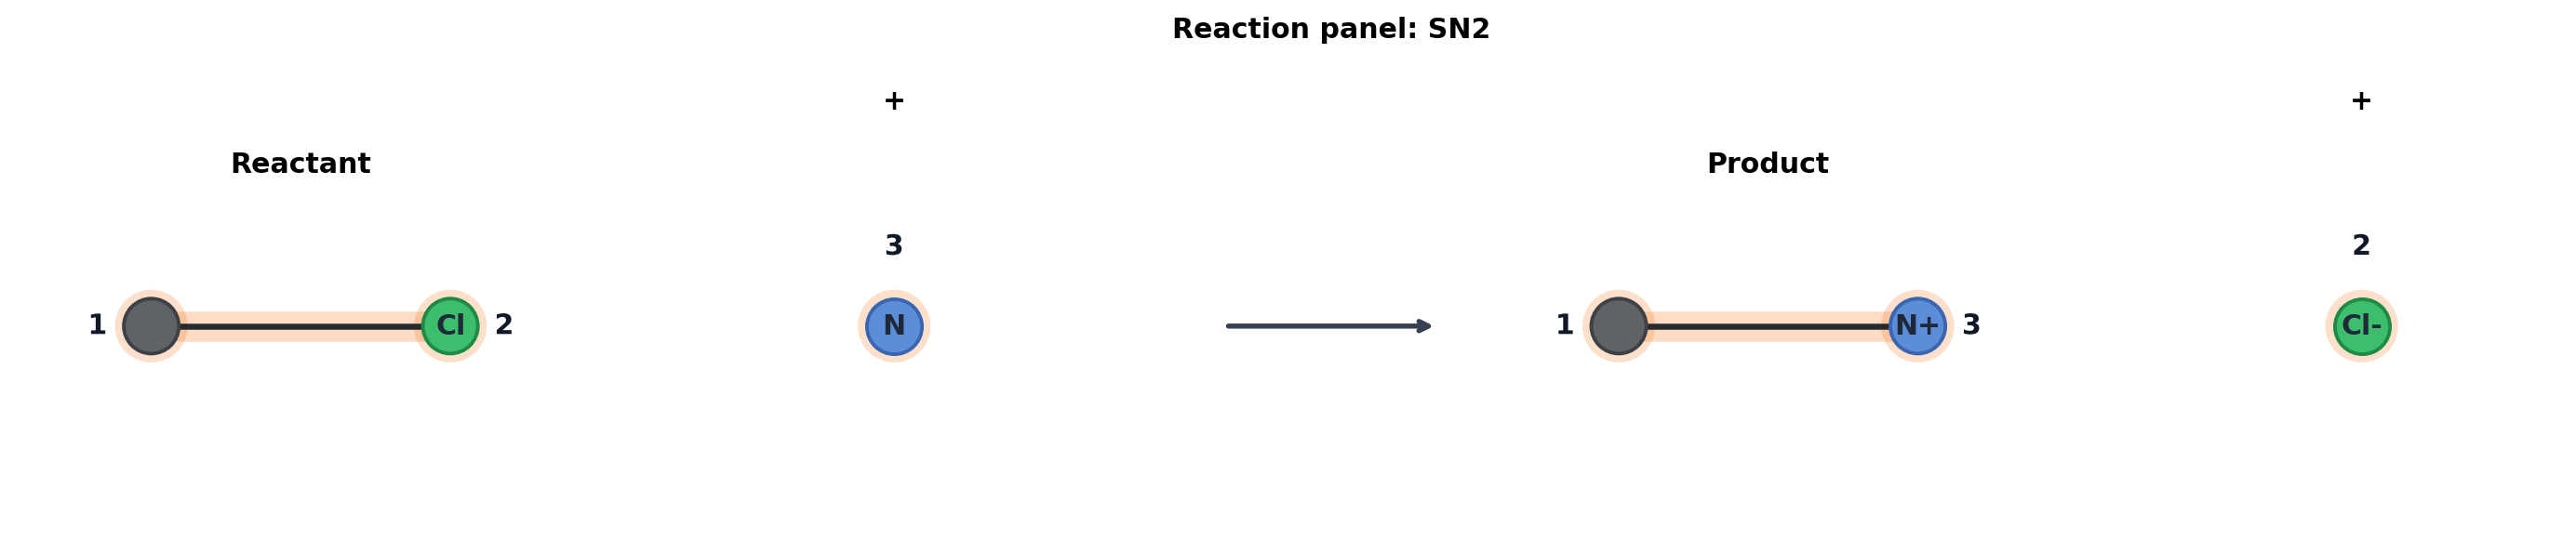
Figure: Reactant/product panels with the reaction center highlighted.
ITS Graphs#
ITS visualization is centered on the transformation graph itself, not the full
reactant/product panels. By default, changed bonds are shown as compact
kekule_order transitions such as 1->0 or 0->1.
from synkit.Vis import draw_its_from_rsmi

rsmi = (
    "[Cl:1][Cl:2].[H:9][c:3]1[cH:4][cH:5][cH:6][cH:7][cH:8]1"
    ">>"
    "[Cl:1][H:9].[Cl:2][c:3]1[cH:4][cH:5][cH:6][cH:7][cH:8]1"
)

fig, axes = draw_its_from_rsmi(
    rsmi,
    format="tuple",
    core=False,
    title="ITS: chlorine transfer to arene",
    edge_label_mode="kekule",
)
ITS edge-label modes:
Mode |
Meaning |
|---|---|
|
Show changed |
|
Show changed sigma/pi components. Unchanged components are suppressed. |
|
Hide edge labels and use only edge color/style. |
Lewis-State Labels#
For Lewis State Graph / ITS graphs, node labels can show charge, lone-pair, or radical changes. Use one signal at a time for readable figures.
from synkit.Vis import draw_its_from_rsmi

sn2 = "[CH3:1][Cl:2].[NH3:3]>>[CH3:1][NH3+:3].[Cl-:2]"

fig, axes = draw_its_from_rsmi(
    sn2,
    format="tuple",
    core=False,
    title="ITS: SN2 lone-pair changes",
    show_electron_labels=True,
    electron_label_mode="lone_pair",
)
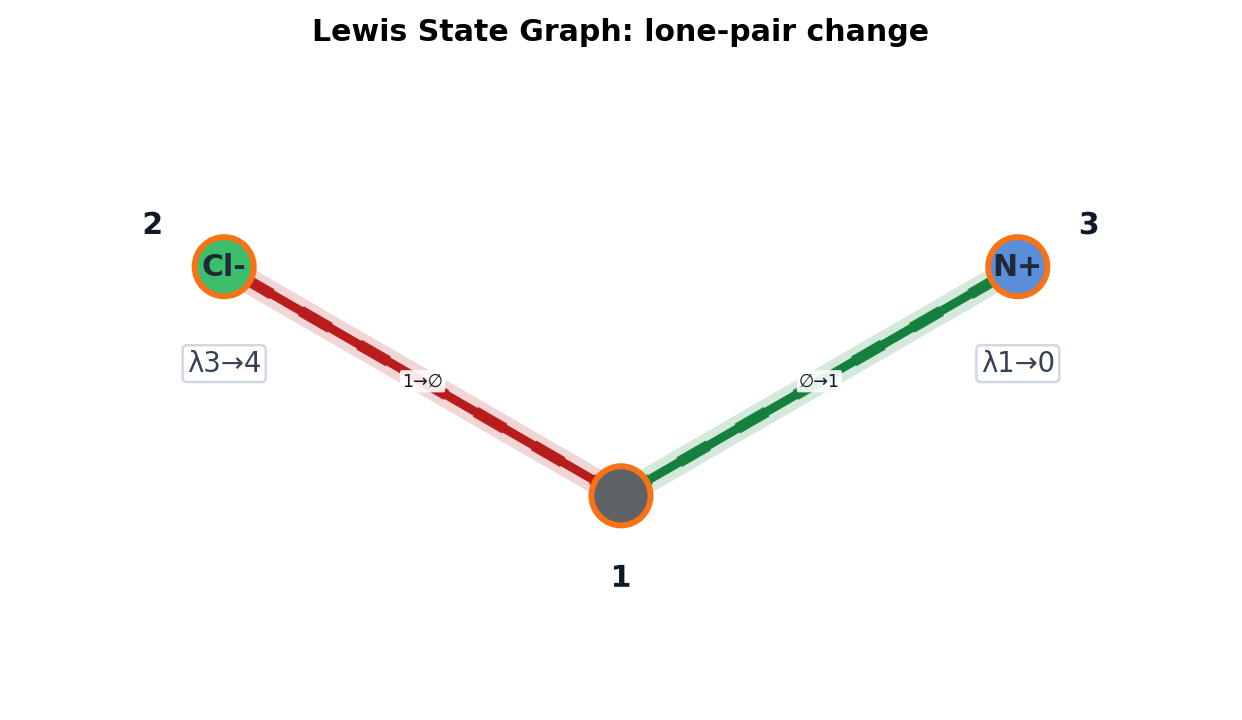
Figure: LSG/ITS view of the SN2 example. Bond colors show broken/formed edges and the node badges show a lone-pair transfer.
Lewis-state label modes:
Mode |
Meaning |
|---|---|
|
Show charge changes, for example |
|
Show lone-pair changes, for example |
|
Show radical changes. |
|
Show every changed Lewis-state attribute. This is useful for debugging but can be busy. |
Reactant/Product Projections#
ITS helpers can also render reactant and product projections when needed for debugging.
fig, axes = draw_its_from_rsmi(
    rsmi,
    format="tuple",
    core=False,
    projection=True,
    title="ITS with reactant/product projections",
)
Use projection=True when you need to inspect how an ITS decomposes back into
left and right molecular graphs. Use the default ITS-only view for reports and
notebooks.
Electron-Pushing Diagrams#
MechanismVisualizer draws curved electron-pushing arrows directly from
generic EPD or typed epd_lw records. It lays out the reactant, product, and
ITS panels consistently, highlights changed bonds, and retains typed action
labels in the step key. The example below starts from EF-SMIRKS, completes and
normalizes it through SynKit’s internal EPD representation, then visualizes
the resulting epd_lw.
import matplotlib.pyplot as plt

from synkit.IO import ef_smirks_to_epd, rsmi_to_graph, rsmi_to_its
from synkit.Vis.epd import MechanismVisualizer

ef_smirks = (
    "[NH3:1].[CH3:2][Cl:3]>>[NH3+:1][CH3:2].[Cl-:3] "
    "1-1,2;2,3-3"
)
result = ef_smirks_to_epd(ef_smirks)
complete_aam = result["complete_aam"]
reactant_graph, product_graph = rsmi_to_graph(complete_aam, drop_non_aam=False)
its_graph = rsmi_to_its(complete_aam, core=False, format="tuple")

fig, ax = MechanismVisualizer().visualize_trajectory(
    reactant_graph,
    result["epd_lw"],
    its_graph,
    product_graph=product_graph,
    title="SN2 electron pushing",
)
fig.savefig("sn2_epd.png", dpi=200, bbox_inches="tight")
plt.close(fig)
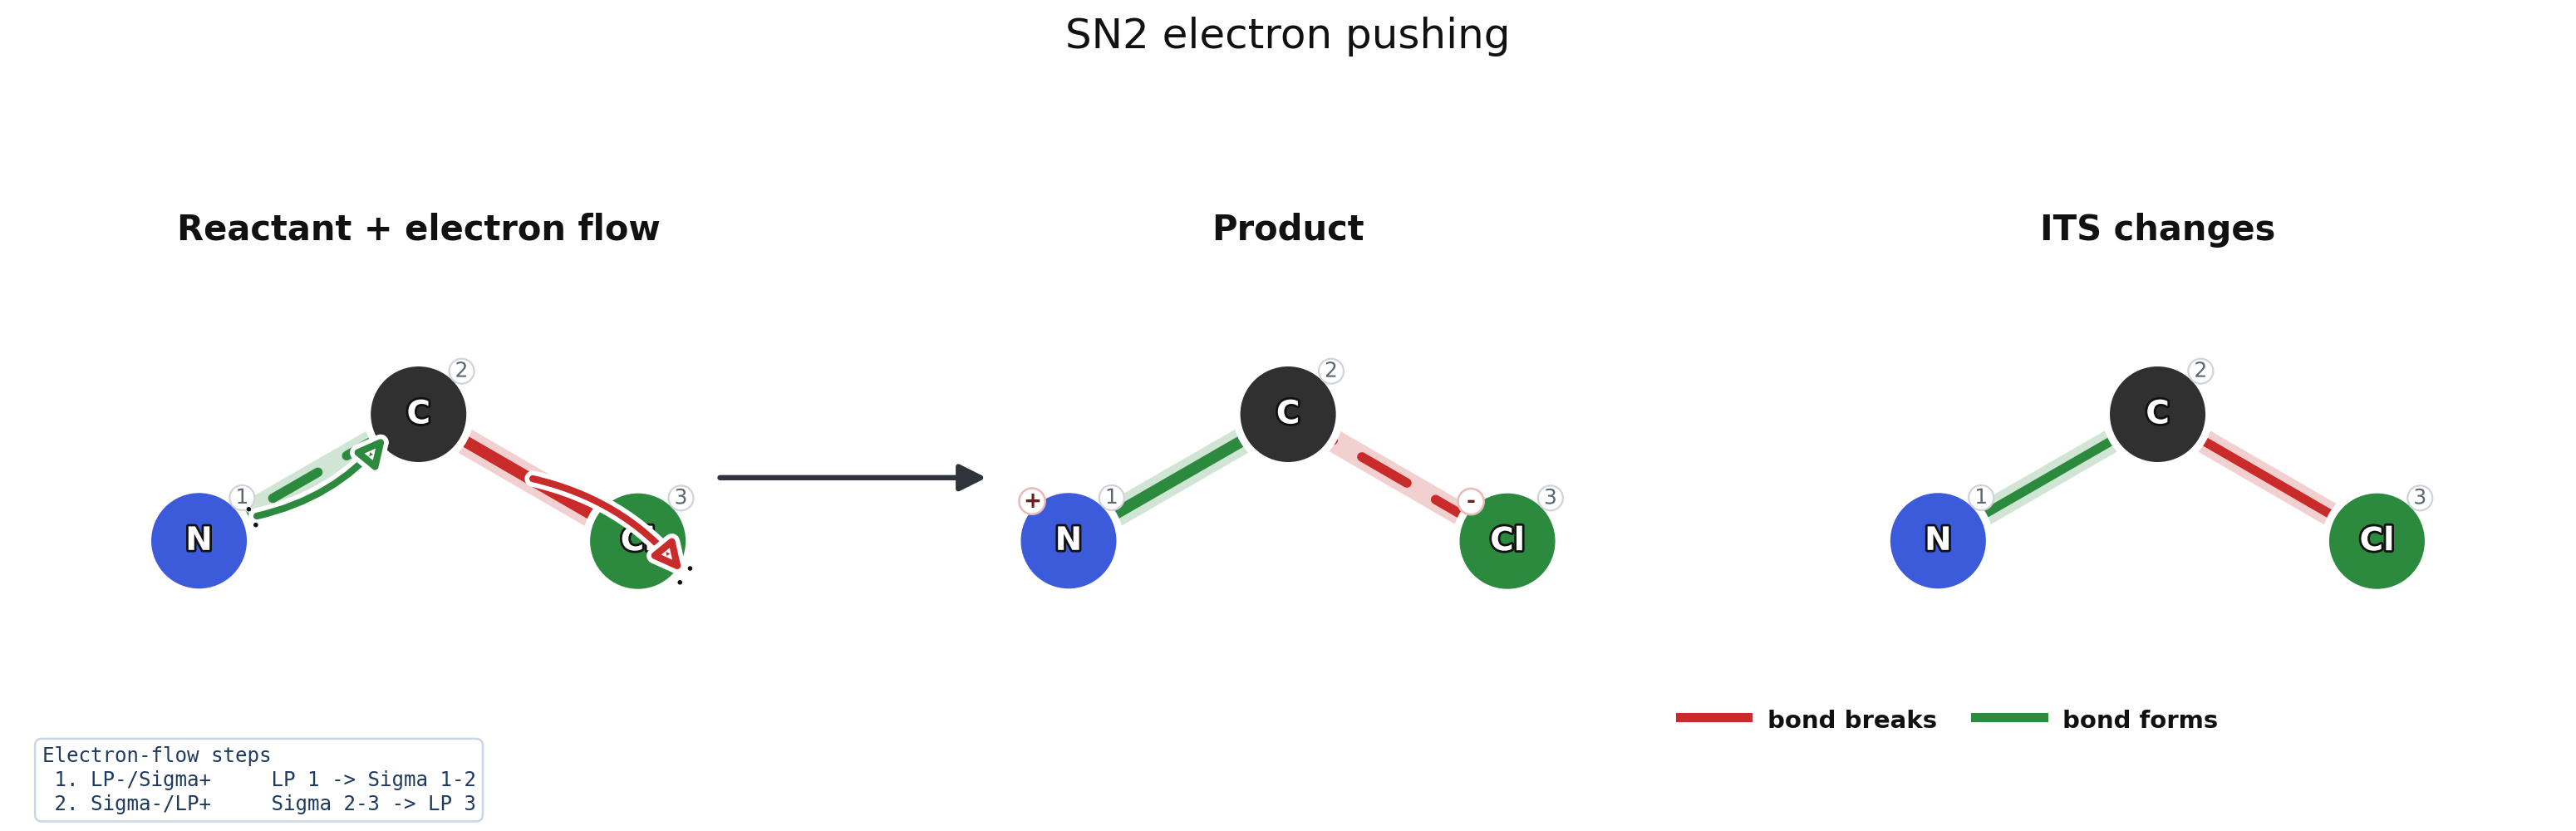
Figure: EF-SMIRKS is converted to complete AAM and typed epd_lw
records before rendering. Green marks bond formation and red marks bond
cleavage.
ef_smirks_to_epd produces compatible epd_lw output, so its result can
be passed to the visualizer as result["epd_lw"]. Use
show_elementary_steps=True with a full graph trajectory when each
elementary arrow group should receive a separate panel.
MTG Timelines#
Compact MTG visualization has two complementary views:
draw_mtg_graphshows the fused MTG as a timeline graph;draw_mtg_stepsreconstructs ordered ITS steps and draws each step with the ITS renderer.
from synkit.Graph.MTG.mtg import MTG
from synkit.Vis import draw_mtg_graph, draw_mtg_steps

# Step RSMI strings are converted to Lewis State Graph ITS by default.
mtg = MTG(step_rsmis, mcs_mol=True)

fig, ax = draw_mtg_graph(
    mtg,
    title="MTG changed core",
    mode="timeline",
    changed_only=True,
    show_edge_labels=True,
    compress=True,
)

fig, ax = draw_mtg_graph(
    mtg,
    title="MTG timeline 3D",
    dimension="3d",
    layout="spring",
)

fig, axes = draw_mtg_steps(
    mtg,
    include_composed=True,
    show_edge_labels=True,
)
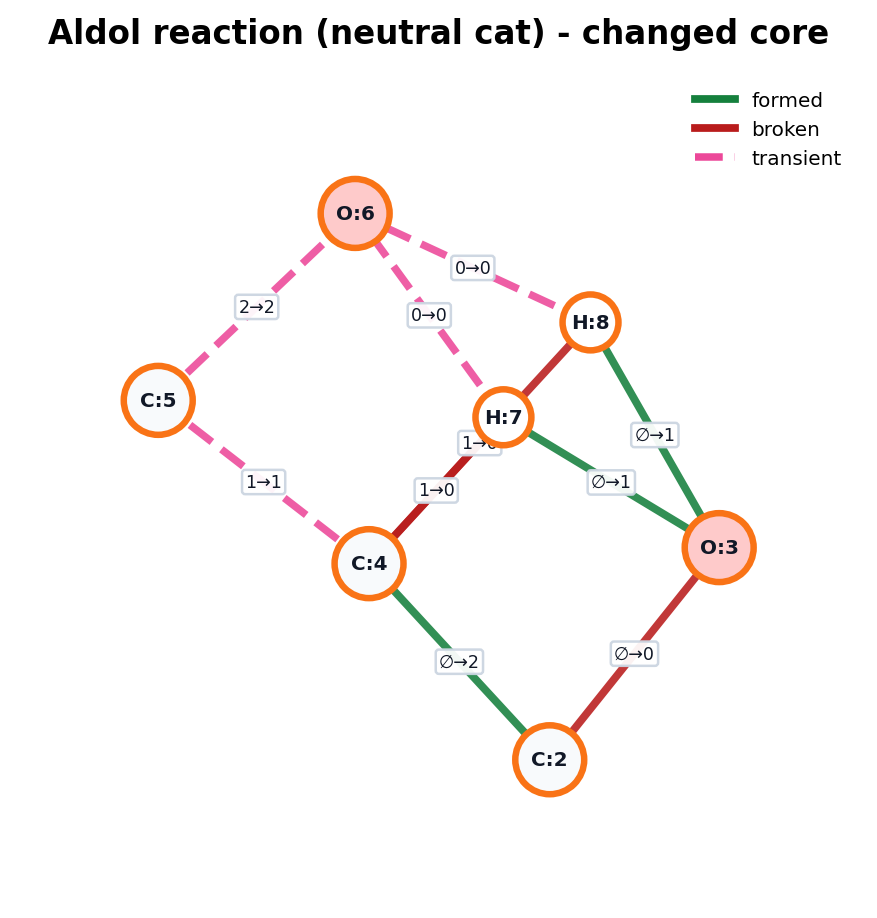
Figure: Compact MTG changed-core view for the neutral aldol mechanism. Green edges are net formed, red edges are net broken, and pink dashed edges are transient timelines.
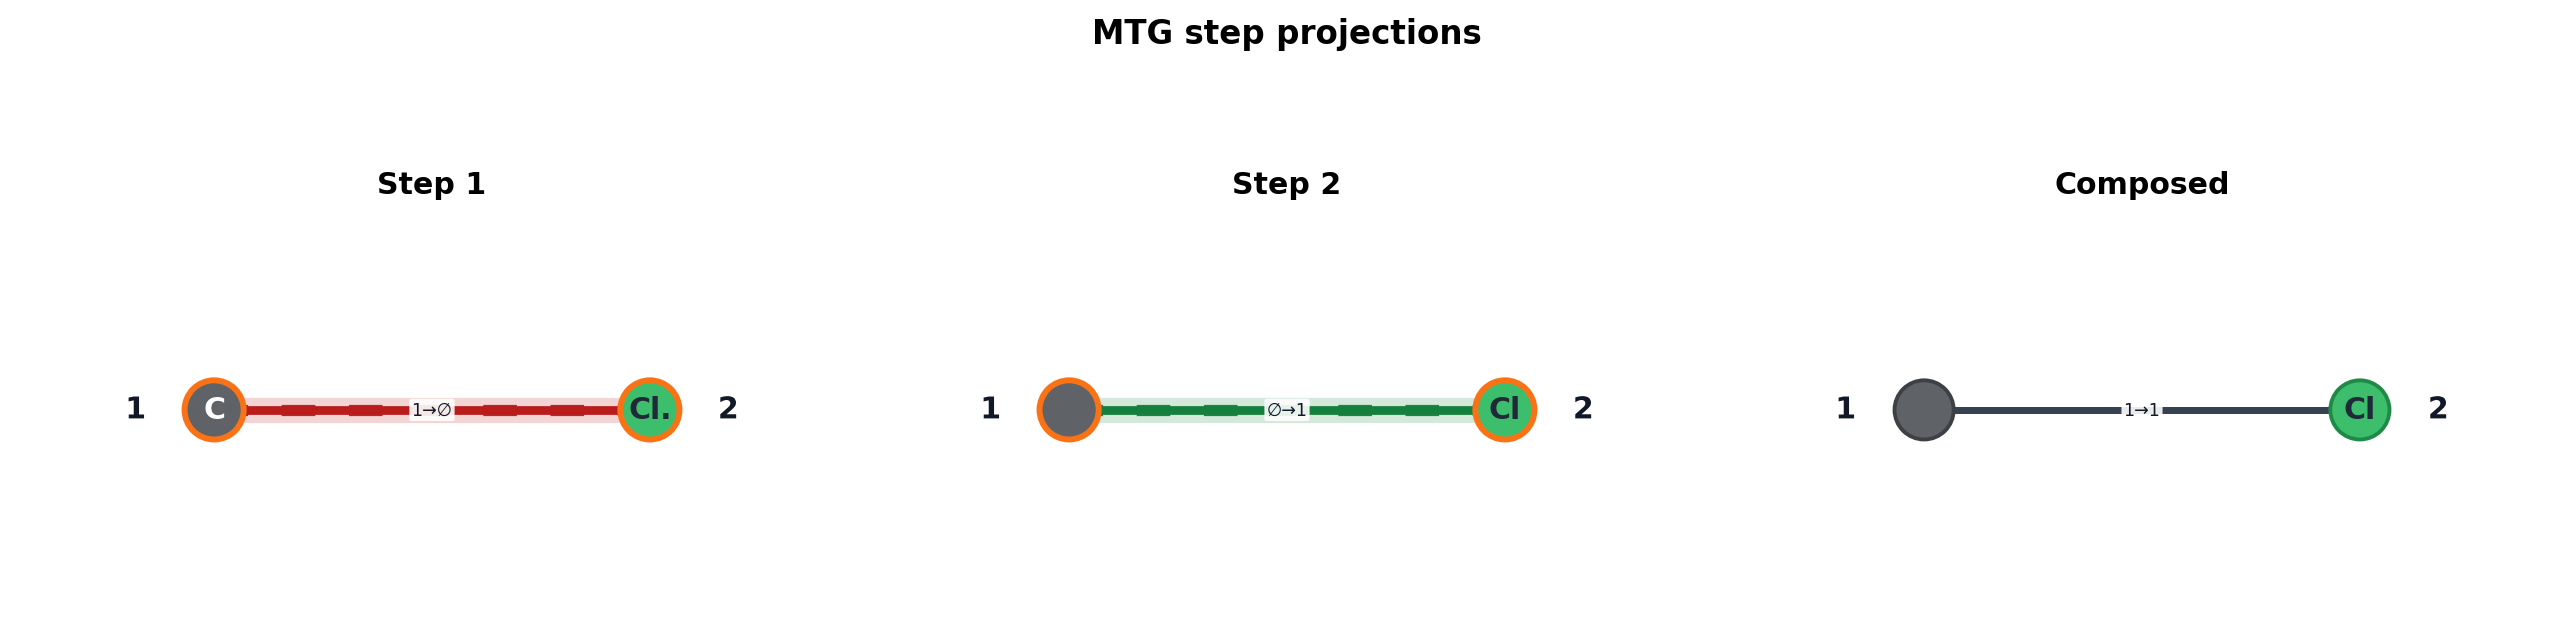
Figure: Ordered ITS step panels reconstructed from the MTG, plus the composed outer-state view.
Use the timeline graph to see transient bonds and Lewis-state paths across the mechanism. Use the step panels when you need to check each reconstructed ITS independently.
The 2D view is the default and gives a flattened changed-core drawing. The 3D view is optional and is useful when a dense MTG has too many overlapping timeline edges in a single plane.
MTG display conventions:
Signal |
Display |
|---|---|
Edge timeline |
Compressed first/final state by default, such as |
Formed / broken edge |
Green for net formation, red for net loss. |
Transient edge |
Pink dashed edge for any changing timeline that is not simple net formation or net loss. |
Step panels |
Reuse the ITS-only renderer so a step can be checked with the same visual language as a normal LSG/ITS graph. |
Diagnostic Graph View#
The visual model adapter normalizes molecule, reaction, ITS, and MTG-like graph objects into a common drawing model. This layer is mainly for development and debugging.
from synkit.Vis import detect_visual_kind, summarize_visual_graph, to_visual_graph
from synkit.Vis import draw_graph

kind = detect_visual_kind(graph)
visual_graph = to_visual_graph(graph)
summary = summarize_visual_graph(visual_graph)

ax = draw_graph(graph, title=f"{kind}: {summary.kind}")
Legacy Helpers#
The older visualization classes are still exported for compatibility:
RXNVisfor reaction image grids;RuleVisfor rule/ITS style drawings;GraphVisualizerfor general NetworkX graph visualization.
New code should use draw_molecule_graph, draw_reaction_graph, and
draw_its_from_rsmi unless a legacy workflow specifically depends on the
class-based API.